Stack tracing: RAW method and frame-based method |
  
|
Stack tracing: RAW method and frame-based method |
|
|
x86-32 has no reliable way to build exact call stack. All stack tracing methods use some kind of assumptions, heuristics and guessing. And sometimes tracing methods may be confused, so you may have a false-positive entries in call stack or missed entries.
x86-64 always uses frame-based stack tracing (see below), because presence of stack frames is a requirement for x86-64 calling convention. x86-64 has single stack tracing model and it's reliable until some code explicitly decides to mess with the stack.
Usually all stack tracing methods are divided into 2 groups: frame-based tracing and RAW tracing methods.
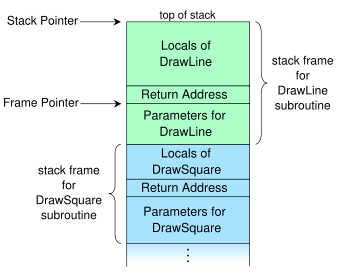
What are stack framesx86 CPU family (both 32 bit and 64 bit) uses hardware stack to store execution path when calling routines (other CPUs - such as Itanium - use other means for that task). Stack frames (also called activation records or activation frames) are special data structures on stack which contains subroutine's state information. Each stack frame corresponds to a call to a subroutine which has not yet terminated with a return. For example, if a subroutine named DrawLine is currently running, having been called by a subroutine DrawSquare, the top part of the call stack might be laid out like this:
The stack frame at the top of the stack is for the currently executing routine. The stack frame usually includes at least the following items (in push order):
A stack frame has a field to contain the previous value of the frame pointer register, the value it had while the caller was executing. For example, the stack frame of DrawLine would have a memory location holding the frame pointer value that DrawSquare uses (not shown in the diagram above). The value is saved upon entry to the subroutine and restored upon return. Having such a field in a known location in the stack frame enables code to access each frame successively underneath the currently executing routine's frame, and also allows the routine to easily restore the frame pointer to the caller's frame, just before it returns.
In other words, stack frames build a chain of frames: each frame contains link to previous frame.
It's important to understand that stack frames are not enforced on x86-32. They may be or may be not created - the decision is up to compiler. Only naked return address may be stored, without any additional information and without link to previous frame. However, stack frames always must be created for x86-64 - because this is a platform's requirement.
Note: x86-32 stack frames are different from x86-64 stack frames. x86-64 uses additional information about functions to work with stack frames. This meta-information is generated by compiler and stored inside executable.
Frame-based stack tracingFrame-based stack tracing builds call stack by using sequence of call frames, which are added to the stack on call of most routines. Usually this method gives acceptable results (if you don’t have too many very short routines - see below). You can increase it’s effectiveness by enabling “Stack Frames” option. This method is quite precise and fast as it looks only for “registered” calls. It don’t scan the entire stack – just walks by sequence of frames, where every call frame points to another. This method will not work if FPO (frame pointer omission) is used (x86-32 only), in cases of non-standard stack's usage (non-standard calling convention) or in case of stack corruption.
Note: the stack tracing method for x86-64 is a frame-based stack tracing method.
Important Note: unfortunately, LLVM/CLang compilers do not set proper stack frame when raising software exceptions ("raise" / "throw"). Therefore, stack frames based methods will not work if you are using LLVM/CLang compiler (in other words, "Use classic compiler" option is disabled). Select any RAW method for LLVM/CLang.
RAW stack tracingRAW tracing method works differently: it just scan the whole stack, trying to find "possible" return addresses. Really: the frames may be or may be not present in the stack (see below). But return addresses are always there. The problem is that there is no 100% way to find them. So, RAW method takes every integer in stack and tries to guess: does it look like return address? For this reason, the RAW tracing methods can be used only with some heuristic algorithm. Created call stacks may differ significantly, depending on quality of the heuristic. Present or missed debug information can also affect call stacks, because heuristic may use debug information to verify return addresses. Consider the following code:
function LoadResString(ResStringRec: PResStringRec): string;
This code will allocate 4 Kb of stack memory for local Buffer variable. This code does not call ZeroMemory or FillChar to initialize Buffer to contain all zeros. Therefore, Buffer will contain whatever was on stack before calling LoadResString. This "stack trash" usually includes a lot of function calls - which are not related to current execution path. RAW method will collect all these false-positive return addresses. See more detailed example below. You can minimize such false-positive entries by doing:
function LoadResString(ResStringRec: PResStringRec): string; FillChar(Buffer, SizeOf(Buffer), 0);
You can also enable "Wipe stack on idle" option.
Note: there is no need for RAW stack tracing methods for x86-64 platform.
How stack frames are generated (x86-32 only)Stack frame may be omitted (not created) in some cases. Consider the following code:
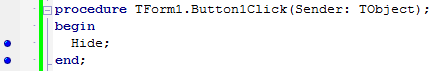
"Stack Frames" option is disabled
Notice that there is no blue "dot" on the left from "begin" line. This means that "begin" line do not generate any code. I.e. there is no code to setup stack frame in this routine. That's because this routine is very simple and do not require stack frame to manage its data.
Note: "end" line generates code. This code is a simple "ret" instruction which returns control to caller.
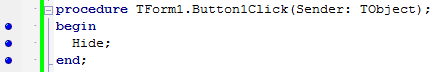
"Stack Frames" option is enabled
This is the same code, but it is now compiled with “Stack Frames” option enabled. Notice that this code has blue "dot" near "begin" line. This means that there is code to set up routine - i.e. there is code to create stack frame. "Stack Frames" option forces compiler to always create stack frames, even if there is no direct need for them.
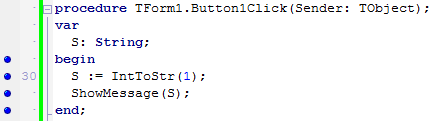
"Stack Frames" option is disabled
This code still have stack frame - despite fact that "Stack Frames" option is disabled. That's because this routine uses string type. String type is auto-managed type, so compiler need to setup initialization and finalization code and create stack frame. Any more or less complex routine (especially with local variables and arguments) will have stack frame regardless of "Stack Frames" option's state - for the same reason: compiler needs stack frame to manage routine's data.
Note: "Stack Frames" option has no effect on x86-64.
How stack frames affects call stacks (x86-32 only)Below are two examples on how stack frames affects call stacks.
Stack frames for offsets EurekaLog and many other diagnostic software allow you to view so-called offsets. Line offset is calculated as a difference between the first line in routine and the line in question. For example:
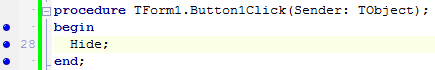
Line numbers for routine with stack frame
A call to Hide method is located at 28[1] line, which reads as "line #28, it has difference in one line from the first line of current routine" (some tools may indicate the same as 28[2], which reads: "second line in the routine" - in other words, some tools may use 1-based numbering instead of 0-based). Anyway, the point here is that the first line for routine is "begin" line. It's not "procedure", it's not first line of source code. That's because start of the routine is defined by code. And first code for this routine appears in "begin" line - which is indicated by a blue dot across "begin" line in editor's gutter. Therefore, "begin" line is the first line in this method (#27), "Hide" line is the second line in this routine (#28). Difference is 1.
As you may have guessed for now: line offsets are affected by stack frames. Consider the same code without stack frame:
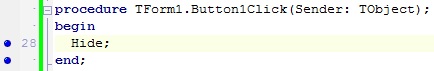
Line numbers for routine without stack frame
A call to Hide method is now located at 28[0] line, which reads as "line #28, it has zero difference from the first line of current routine - i.e. it is actually a first line" (again, some tools may use 28[1] for the same fact). First code for this routine appears in "Hide" line in this case. Therefore, "begin" line is not the first line in this method, it does not generate any code, "Hide" line is the first line in this routine (#28). Difference is 0 (sinse it's the same line).
Stack frames for frame-based methods RTL and VCL units are compiled with "Stack Frames" option turned off. This means that any frame-based method will not be able to find short routines in RTL/VCL units.
However, this fact also have less obvious consequence. Consider this code:
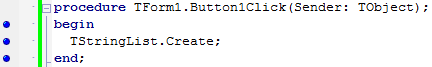
A simple object leak with "Stack Frames" option enabled
This code creates a simple memory leak by leaking instance of TStringList. EurekaLog will detect a leak and build call stack for it. As you can see, Button1Click routine has stack frame due to "Stack Frames" option being enabled. One may expect that frame-based tracing method will discover a call to Button1Click and add it to the call stack.
This is not so.
The stack frame for Button1Click allows method to identify the caller (in this case: TControl.Click). That's because stack frame does not contain information about routine itself. It contains information about the caller: return address. Return address for Button1Click routine will point to TControl.Click.
But what about Button1Click? Since TStringList is a class from RTL - it's compiled without "Stack Frames" option. Thus, constructor does not have stack frame (because it's very simple code and do not require stack frame). Therefore, it's not possible for frame-based tracing method to identify Button1Click routine.
Note: you can recompile RTL/VCL with "Stack Frames" option turned on.
However, if you change code like this:
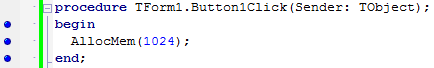
Memory leak with "Stack Frames" option enabled
This code will leak anonymous memory block. AllocMem is routine from memory manager. It also do not have stack frame (because it's assembler stub). However, EurekaLog will be able to identify Button1Click routine with any stack tracing method (including frame-based one). That's because EurekaLog is awared of standard memory routines and able to extract return addresses from these routines regardless of stack frames.
The difference between two samples: first code example uses "some (unknown) code (class)", the second code example uses known memory manager function.
So, Button1Click routine will be detected in this case.
False-positive entries for RAW-based methodsConsider the following code:
procedure P1;
The idea here is that we have a call tree that was completed - P1. It is not executed currently, but was executed before. Right now we are in another code branch - P2, which has nothing in common with P1.
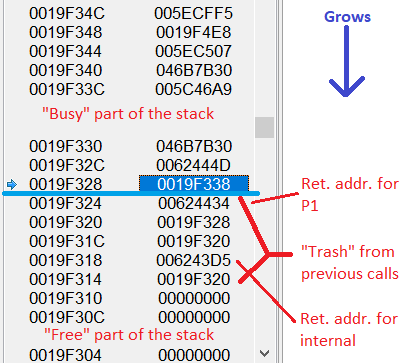
Let's take a look at CPU stack right after return from P1, but before entering P2:
CPU stack after call to P1
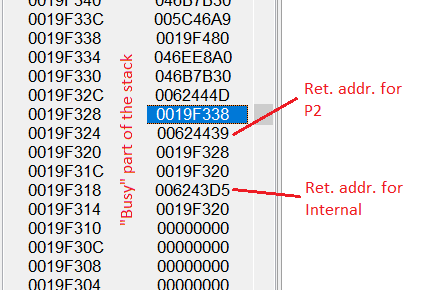
As you can see, the "free" part of CPU stack is not zeroed out, it still contains old values from previously completed calls. The code of P2 does not erase or modify these values. Therefore, these values are still there when we are about to raise exception:
Return address for Internal procedure is still on the stack
This means that RAW tracing method will find (in that order):
Notice how this will generate a false-positive entry Internal. A real call stack should be:
Note: EurekaLog tries to eliminate such cases by analyzing assembly code and using other heuristic. However, it is not possible to remove false-positive entries with 100% efficiency.
Therefore, when using RAW tracing - you always have to analyze call stack for false-positive entries.
For example, a call stack from RAW tracing may be like this:
You can manually clean it from false-positive entries (as well as non-important entries) to get this:
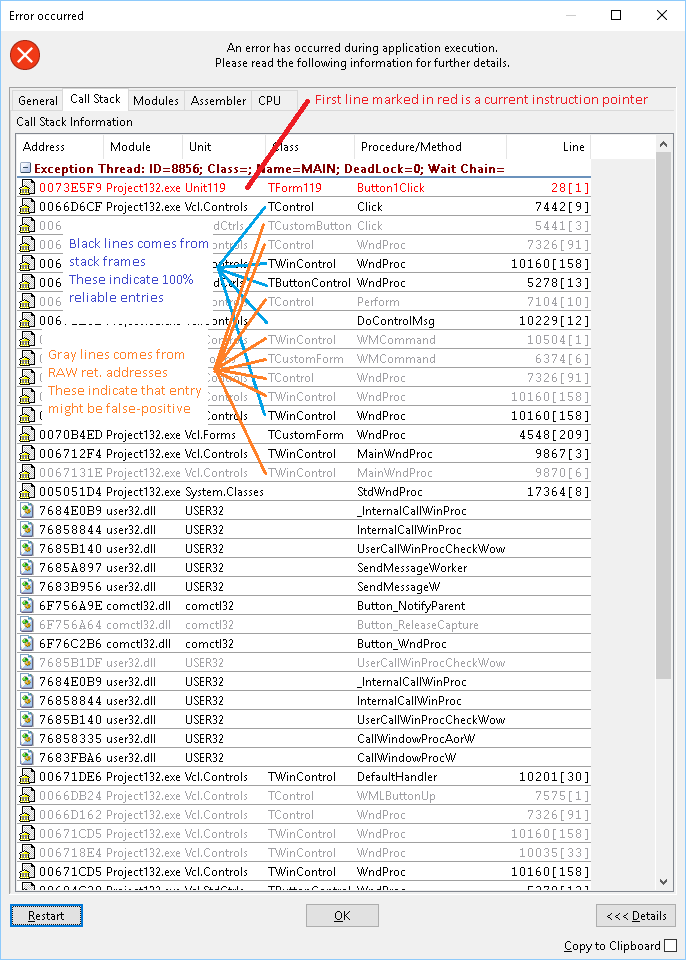
EurekaLog tries to help you with manual cleanup by color-coding call stack entries:
Call stack's color coding
Note: For above mentioned reasons - all entries for x86-64 are marked black.
Important Note: It is not possible to store information about stack frames for allocated memory blocks (in other words, leaks checking). Therefore, call stacks for leaks (and other memory issues) will be marked in one color, regardless of stack frames presence. Black call stacks indicate that frame-based tracing was used. Gray call stacks indicate that RAW-based tracing was used.
ConclusionsShort summary of the above discussed facts:
Important note: please remember that call stack's usefulness highly depends on available debug information from modules. EurekaLog extracts debug information with help of debug information providers. You have to enable (to include) required providers in case if you're going to use non-EurekaLog formats. Most remarkable formats are DLL exports and Microsoft debug formats. Debug information providers can be enabled or disabled under Advanced / Code / Debug information.
See also:
| ||||||||||||||||||||||||||||||||||||||||||||||||||||||||||||||||||||||||||||||||||||||||||||||||||||||||||||||||||||||||||||||||||||||||||||||||||||||||||||||||||||||||