Leaks |
  
|
Leaks |
|
|
While any error in your application is always bad, there are types of errors, which can be not visible in certain environments. For example, memory or resources leaks errors are relatively harmless on client machines and can be deadly on servers.
Memory leaks are a class of bugs where the application fails to release memory when no longer needed. Over time, memory leaks affect the performance of both the particular application as well as the operating system. A large leak might result in unacceptable response times due to excessive paging. Eventually the application as well as other parts of the operating system will experience failures.
Windows will free all memory allocated by the application on process termination, so short-running applications will not affect overall system performance significantly. However, leaks in long-running processes like services or even Explorer plug-ins can greatly impact system reliability and might force the user to reboot Windows in order to make the system usable again.
Applications can allocate memory on their behalf by multiple means. Each type of allocation can result in a leak if not freed after use. Here are some examples of common allocation patterns:
Item 1 is called "memory leak" in EurekaLog; items 2-5 are called "resource leak" in EurekaLog.
Why leaks are bad and do I always need to release all memory?Generally speaking, often mem-leak does not mean any visible problem to a user: application still works. Mem-leaks? So what? Program still do all tasks, that I need from it. This is especially true for client applications: cause they work for a limited amount of time. So mem-leak is not scary - since all memory will be reclaimed at application's exit (refer to Jeffrey Richter's book on native code for more info) and so all leaks will be removed too. No, I don't mean that you don't need to fight mem-leaks here: mem-leak is always bad. It is just that mem-leaks aren't that fatal. Of course, this is not applicable for server applications. Server applications work for long period of time, so even minor leak will be deadly.
Some other question, which is close related to above, is: "if all memory is reclaimed upon app's shutdown - can I skip cleanup for global variables? They still will be deleted by automatic cleanup from OS!"
Well, the formal answer is: "you can do it". This is correct and you really can do it. But "can" does not mean "should". Obviously, there will be no technical problems with that approach. So, why is this bad?
Because you can't find a real mem-leaks, if you do like this. If you don't pedantically clean all of your resources - you will get a bunch of mem-leak reports. Well, leaks "by design": technically it's a leak (since resource wasn't released), but it is not a logical leak. Since you know, that those aren't reports about real mem-leaks - you will ignore them. And the problem is that if there will be a report about real leak - you may just miss it.
That's why it is a common "good rule" to always clean your resources. Unfortunately, there can be cases, when you can't do that. Those are very rare cases, but it can happen. But general rule is: always clean your resources, if you can do it. Don't rely on system's cleanup to throw out garbage for you. This will greatly simplify your life in the future.
Wrong approachWhen newbie is inspired of the idea of catching memory leaks - he usually opens the Task Manager and watches "Mem usage" column.
So far so good, but then he suddenly notices that this column behaves very strange, even in a simple application: the memory is not decreasing when closing forms, but decreases at minimizing application, etc, etc. A good question: why does newbie think that this column represents memory allocated by his code? If you open "View"/"Select columns" menu - you'll see many other counters, which also matches "memory definition".
So, I'll open a little secret here: the "Mem Usage" column in Task Manager represents amount of RAM, occupied by your application. This value is not the memory, allocated by your code (you can figure out this by yourself, when you first encounter disappearing of memory at minimizing - of course, no one is going to free your memory without your permission). Your application can use less RAM, then your code allocates, since it can be swapped out to page file. And besides, RAM is spend for code too - namely, for system libraries. System libraries are loaded in every process, but there is only one copy of each DLL in system's memory! (I mean only code here). This value is also called "Working Set". You can see many memory-related values in Task Manager by configuring columns. Or you can use Process Explorer tool (add more columns into process list view too).
So let leave our Task Manager for a while and take a look at Pascal. How Delphi manages its memory? All memory in Delphi application is controlled by memory manager. You can change the memory manager in your application by calling SetMemoryManager. That means that you can detect memory leaks very easy - by installing analyzer stub for memory manager.
What does it mean that your application has a memory leak? Well, this means that your code allocates some memory (object, string, array, etc) and forgets to release it. Forgetting about memory's block means that this memory will still be there at application's exit.
So, to catch all memory leaks you need to enumerate all busy memory blocks at application's exit. Every such block will represent a memory leak.
Using EurekaLog to find memory leaksEurekaLog has a functionality of catching memory leaks too. It is off by default - because it is not free for your application. Enabling this functionality means a little slow down and increased memory usage. This feature has its limits, but it can be very useful for debugging memory leaks on client's machines.
Note: memory leaks catching feature in EurekaLog is made as light-weight - to minimize performance/resource impact on your application. Thus, you can use it in your application deployed on end-user machines. However this means that EurekaLog provides less information than debugging solutions. The primary target of EurekaLog is to let you know about the problems. Surely, you can use EurekaLog to debug problems too, but it can be not suffice in some cases. So you may need to use other debugging tool which is designed to debug problems, not to report them "from the fields".
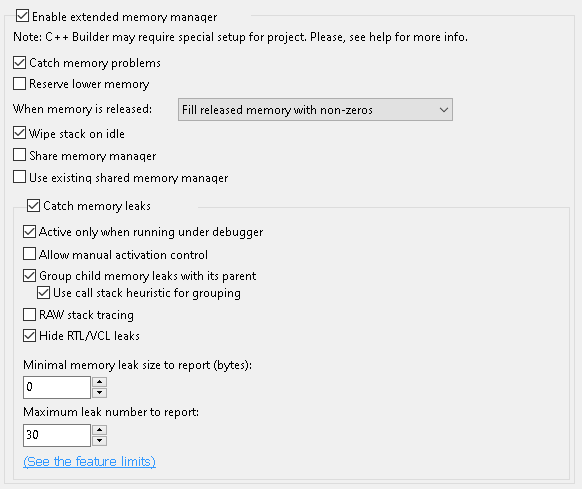
In any case, to enable this feature - you need to check "Catch memory leaks" option on "Memory problems" tab:
Memory debugging options
There are bunch of options which controls memory leaks checks activation and its behaviour. See this section for more details about each option.
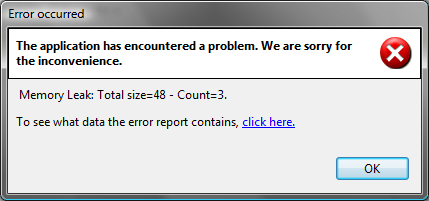
Anyway, if you activate memory leaks checks and there will be a memory leak in your application at run-time - there will be a usual error dialog at application's exit:
Memory leaks in MS Classic style dialog
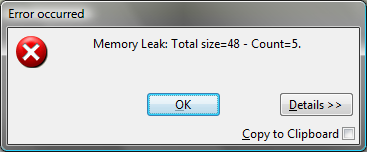
Memory leaks in EurekaLog style dialog
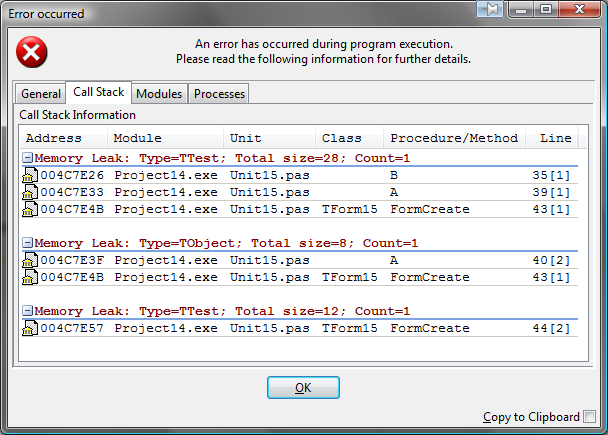
Memory leaks in detailed dialog
As you can see: all memory leaks will be gathered in one single report, which can be send to you as any other EurekaLog report. The only differences from other kinds of reports are: no CPU and Assembler tabs and no calling of event handlers.
How to resolve memory leaksMany people seems to miss the whole point of mem-leak reports. Typical approach of working with bug report for many people is to open code location from call stack and analyzing it. The problem is: memory leak report does not point to the problem.
Note: be sure to read Reading and understanding bug report first, especially Searching bug's location part.
Let's think for a second: what is a leak? Leak is... well, it is when we allocate something and do not release/free it. So, mem-leak report can (and, actually, will) contain that "something" - a resource; and it contains "allocation" - i.e. call stack to line of code, which allocates resource. But where is our problem? An actual problem is sitting at "release/free" moment! A tool can not know: where did you (your code) planned to release resource. That's why report contain only information about allocation. There is no direct information on the problem in the report.
What does it mean, "the problem is in release"? It means, that either we lost pointer to resource or we do have a pointer, but our release routine wasn't called for some reason. And those are points, which you should look at.
So, what should you do with mem-leak report? Well, you first need to follow call stack and find code. But the next thing is different (comparing to exception bug report): you don't need to analyze this line. You need:
As it was already said: there can be 2 reasons for item 3 - either we lost reference or we missed the call.
If you have problems identifying resource - try to name it.
Delphi's bugsBefore starting doing anything - make sure, that the problem really exists: run your application in wild run without debugger. This will eliminate any possible false mem-leaks like this.
Aside from IDE's bugs, there can be bugs in RTL/VCL too: example. It can be direct bugs (and there is change for their fix in next Delphi version - example), or things that just can't be fixed. Anyway, both cases introduce a mem-leaks in your application and your code has nothing to do with it.
So what can you do here? Putting patching apart - the only thing you can do is to ignore them (since you can't fix them). Yes, this is a workaround. You don't fix a problem - you just hide it, so you can concentrate on problems, which you can fix. The main danger here is overuse of such routines: do NOT add all mem-leaks as "registered" - don't forget that this will not fix the problem!
Best PracticesCertain coding and design practices can limit the number of leaks in your code:
See also:
| ||||||||||||||||||||||||||||||||