Memory problems page |
  
|
Memory problems page |
|
|
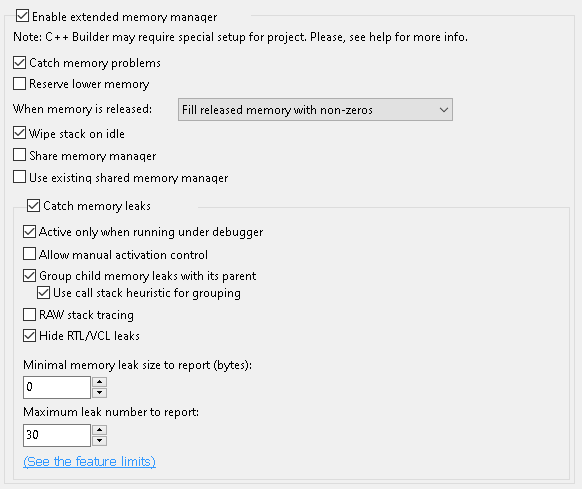
This is "Memory problems" page in EurekaLog project's options.
Memory debugging options
EurekaLog is capable to track many problems with heap memory (dynamically allocated memory).
1. "Enable extended memory manager" option enables EurekaLog's filter for memory manager. Installing debugging filter allow EurekaLog to perform additional checks. You must turn this option on, if you want to use debugging memory features of EurekaLog.
Notes:
Important note: it is recommended to always keep this option on, unless you need shared memory manager and need to communicate with module without EurekaLog's memory manager (or without EurekaLog at all) and without FastMM (EurekaLog is compatible with FastMM). We highly do not recommend to turn this option off on RAD Studio 2007 and earlier.
See also: using with shared memory manager.
You also need to enable at least 1 sub-option to get real work from this option. If you just enable "Enable extended memory manager" option, but don't select any sub-options - there will be no additional checks running.
2. "Catch memory problems" option enables checking for memory mis-use. Once wrong memory operation is detected - an exception will be raised. If you turn off this option - you code may perform invalid memory operation and continue running without noticing.
Memory mis-use includes the following:
You can use EMemLeaks.MemLeaksErrorsToIgnore global variable to exclude certain checks (such as out of memory errors).
Enabling this feature has very little impact on the speed and memory consumption. It requires allocating few ten bytes more for each allocation.
Notes:
3. "Reserve lower memory" option reserves the lower 2 Gb (32-bit) or 4 Gb (64-bit) of the virtual address space. It causes all memory allocations and DLLs to be allocated at higher addresses. Doing so can help catch bugs with integer/address overflows and bad integer/pointer casts.
This option reserves the memory only. Memory is not allocated (committed). Therefore, memory usage of your application will not increase.
Important Notes for 32-bit applications:
We recommend to always enable this option for 64-bit applications.
You can also reserve lower memory at run-time by calling the ReserveLowerMemory function.
4. "When memory is released" option specifies behavior for cleaning up releasing memory.
Notes:
5. "Wipe stack on idle" option will clear unused part of the stack when application goes idle. An application is idle when it is not processing code. For example, an application is idle when it is waiting for input from the user.
Enabling this option will help catch use of uninitialized local variables, as well as reduce number of false-positive entries in call stack. We recommend to enable this option. Disable this option to get better performance.
Notes:
Important:
6. "Share memory manager" option enables installation of shared memory manager.
If you need to share memory manager or if you've already used shared manager before using EurekaLog - turn this option on. If there will be shared memory manager already present (installed by another module) - your module will use installed one. Your settings for memory manager will be ignored in this case.
This option allows sharing of the memory manager between .exe and DLLs which were also compiled with EurekaLog and this option enabled. This allows you to pass strings and dynamic arrays to DLL functions (and receive them from DLLs), provided that all modules are compiled with EurekaLog and this option enabled. Sharing will only work if the module that is supposed to share the memory manager was compiled with the "Share memory manager" or "Use existing shared memory manager" option set.
Notes:
See also: using with shared memory manager.
7. "Use existing shared memory manager" option works the same as "Share memory manager" option, except it doesn't install shared memory manager, if there is no other shared memory manager set. I.e. your module will use installed shared memory manager, but will not install new one.
Note: use this option with caution, because statically-linked DLLs are loaded before .exe, so there may be unexpected initialization order. This leads to case, when some DLLs do not use installed shared memory manager. For this reason - consider using only "Share memory manager" option for common cases.
8. "Catch memory leaks" option enables memory leaks checking. Memory leak is a memory block which wasn't released. Usually it's a bug in your application.
If this option is unchecked - there will be no additional checks performed. If this option is checked and your application doesn't have any memory leak bugs - there will be no difference in application's behaviour. If this option is checked and your application has leaked the memory - there will be a usual EurekaLog's error message on application's shutdown. This error message will use dialog and send option as set in EurekaLog's options.
Notes:
9. "Active only when running under debugger" option alters activation behaviour of "Catch memory leaks" option.
If this option is checked - memory leak detection will only be activated when running application under debugger (like IDE). This can be useful if you want to debug your applications on developer's machine, but do not want to annoy end-users with useless error reports (because in most cases memory leaks don't bother end-users).
Note: it's recommended to always keep this option on, unless you're creating a server or service application.
10. "Allow manual activation control" option alters activation behaviour of "Catch memory leaks" option. If this option is checked - memory leak detection can be manually turned on or off via command-line switches.
Use "/EL_EnableMemoryLeaks" to enable memory leak detection. Use "/EL_DisableMemoryLeaks" to disable memory leak detection. Use "/EL_DisableMemoryFilter" to disable extended memory manager (see option #1 above).
If this option is unchecked - these command-line switches are ignored. If this option is checked - these command-line switches will turn on or off memory leaks detection. Command-line switches will override any other check for memory leak detection activation.
This option can be used with "Active only when running under debugger" option.
This option is useful, when you want to temporary enable memory leaks detection - for example, you can activate "Active only when running under debugger" option and deploy your application to end customers without bothering them with leaks error report. However, if some customer will report problems with memory usage - you can always advise to use command-line switch to enable memory leaks detection.
Note: it's not possible to enable extended memory manager via command-line switches.
11. "Group child memory leaks with its parent" option hides child leaks from reports. A parent memory block is typically an object, which is responsible for deleting child memory block.
A typical example would be:
For example:
type TComplexLeakObject = class private FData: Pointer; public constructor Create; destructor Destroy; override; end;
{ TComplexLeakObject }
constructor TComplexLeakObject.Create; begin inherited;
FData := AllocMem(10240); end;
destructor TComplexLeakObject.Destroy; begin if Assigned(FData) then begin FreeMem(FData); FData := nil; end;
inherited; end;
var LeakedObject: TComplexLeakObject; begin LeakedObject := TComplexLeakObject.Create; end;
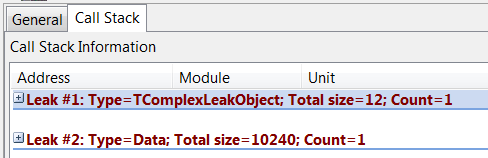
This code will create 2 leaks: 1 for LeakedObject and 1 for LeakedObject.FData. If "Group child memory leaks with its parent" options is unchecked - you'll get report about 2 different leaks:
"Group child memory leaks with its parent option" is unchecked
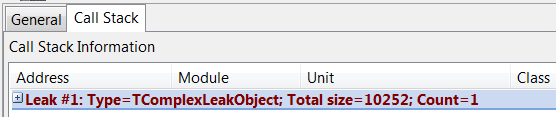
If this option is checked (and "Use call stack heuristic for grouping" option checked - see below) - you'll get report only about 1 leak (LeakedObject). LeakedObject.FData will be hidden and size of LeakedObject.FData's leak will be added to LeakedObject's leak:
"Group child memory leaks with its parent option" is checked "Use call stack heuristic for grouping" is checked
You can declare parent-child relationship manually (explicitly) between almost any two memory blocks by calling functions from EMemLeaks unit.
Notes:
12. "Use call stack heuristic for grouping" option enables automatic parent-child grouping via call stack. When memory block ("parent") is an object and this option is enabled: EurekaLog will search for any other memory blocks that share the same call stack as the parent block. This search will return all blocks that were allocated in parent's constructor.
Important note: enabling this option will greatly increase time to build leak report. Do not enable this option if your application have a lot of leaks (e.g. like one million objects).
Notes:
13. "RAW stack tracing" option switches EurekaLog to use RAW tracing method for building call stacks for memory issues. By default EurekaLog uses frame-based tracing method.
RAW stack tracing can show more complete call stacks, but it's significantly slower. See also: RAW method and frame-based method.
Turn on for best detalization. Turn off for best performance.
Note: it's recommended keep this option unchecked, until you face problem which you can't solve without more detailed call stack.
Warning: we do not recommend to deploy release build of your application with "RAW stack tracing" option enabled. Performance of your application will be significantly lower.
Important: if you are running with RAW tracing under debugger - the tracing may occasionally raise access violation exceptions (from IsValidCallSite called from TracerProcLeaksRAW). This is normal, it is not a bug. Access violation exception will be handled within tracing code, it will not pop up to upper exception handlers.
14. "Hide RTL/VCL leaks" option hides known RTL/VCL leaks. There are some leaks which are "by design" or are bugs in old Delphi/C++ Builder versions. You can't fix them, but you can ignore them.
Turn on to hide expected leaks or leaks from RTL/VCL bugs. Turn off for better detalization.
Note: if you found another "known bug" of Delphi/C++ Builder - please, send us a description and demo, so we'll be able to exclude this leak from reporting and improve our "Hide RTL/VCL leaks" option.
15. "Minimal memory leak size to report" option allows you to ignore small leaks.
If you set this value to 0 - EurekaLog will report all leaks. If you set it to some value > 0 - EurekaLog will only report leaks, if total leaked memory's size is greater than (or equal to) the specified value.
Set to 0 to increase detalization. Increase value to decrease report's noise.
16. "Maximum leak number to report" option allow you to limit count of reported memory leaks. This is useful option, if situation is so bad so your application generates huge amount of leaks.
If you set this value to 0 - EurekaLog will report all leaks (use with caution). If you set it to some value > 0 - EurekaLog will only report this number of leaks, ignore all other leaks. I.e. EurekaLog will report only first <N> leaks, where N is entered value.
Use this option to limit size of memory leak reports, to avoid creation of huge bug reports (and avoid temporary hung at shutdown, when EurekaLog will busy creating report).
Increase value to increase detalization level. Decrease value to reduce noise and decrease report's size.
Notes:
See also:
| ||||||||||||||||||||||||||||||||||||||||||||||||||||||||||||||||||||||||||||||||||||||||||||||||||||||