EurekaLog is a complete bug resolution tool for Delphi and C++Builder developers that gives your application the power to catch every exception and memory leak, directly on the end user PC, generating a detailed log of the call stack (with file, class, method and line number), optionally sending you a copy of each log entry via email or to a web bug-tracker.
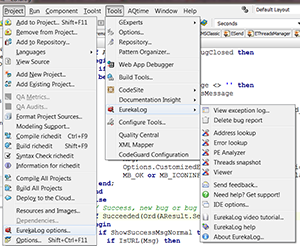
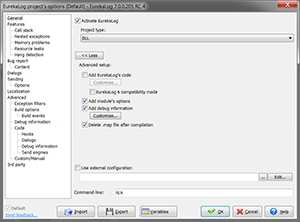
When you install EurekaLog, a new menu option is added under the "Project" menu of Delphi/C++Builder IDE: it allows you to access the configuration of the EurekaLog for your project.
Another new menu named "EurekaLog" is also added under the "Tools" menu to allow the access to the EurekaLog's global configuration and additional tools.
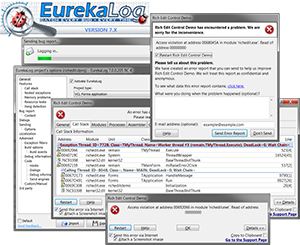
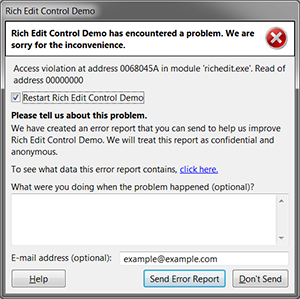
This is the "simple" dialog that EurekaLog shows when it runs into GUI (standard graphical application) applications. You can show or hide any control in this dialog or alter icon and text messages. See here for more screenshots.
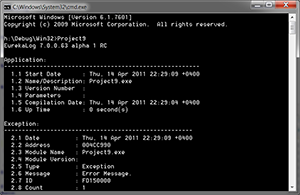
This is error dialog for console applications. It can be customized to display error message only, call stack or a full error report dump. See here for more screenshots.
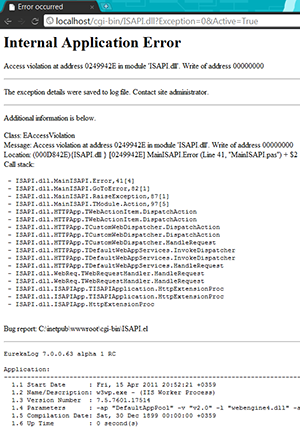
Web dialog is used by WEB-applications (CGI, ISAPI, IntraWeb). Web dialog is a fully customizable HTML-page. See here for more screenshots.
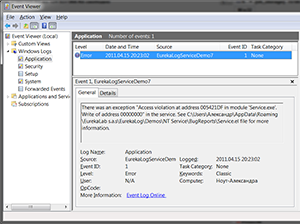
You can use logging to system log instead of error dialog. This is useful for non-visual applications (services, web, etc.). See here for more screenshots.
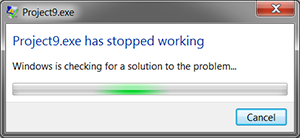
Windows Error Dialog can be used in any application. This is a standard system error dialog, which also can be customized. Visual aspect of this dialog is defined by host operating system. It will be different for, say, Windows XP and Windows 7. See here for more screenshots.
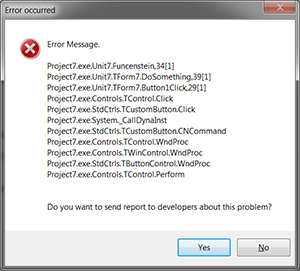
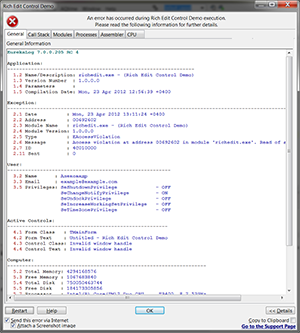
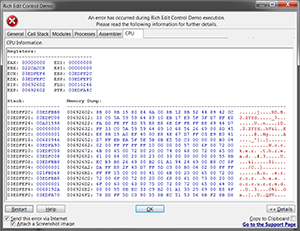
This is "advanced" dialog for GUI applications. It shows you content of your error report - general run-time information, call stack, modules, processes, assembler and CPU dumps. See here for different options.
First tab displays different run-time information about application and system.
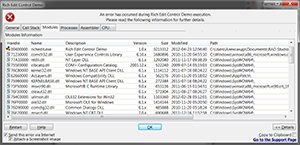
Modules tab displays current application's loaded DLLs and packages.
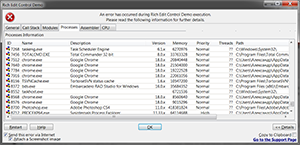
Processes tab displays running processes in the system.
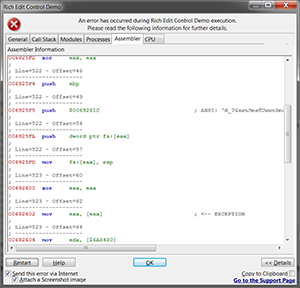
Assember tab displays disassembly dump of exception location.
CPU tab displays state of CPU.
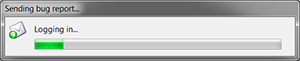
You can enable visual feedback for sending error reports via e-mail or web. Or you can disable it and send reports in background.
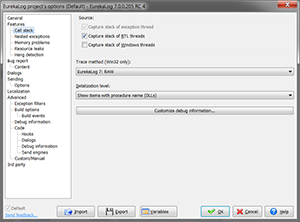
You can specify call stack tracing options.
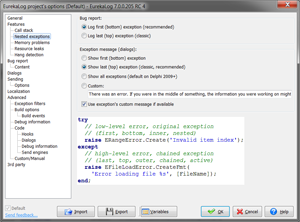
You can easily customize nested and chained exception's behaviour.
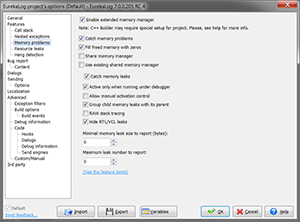
There is wide range of options for memory leaks. You use leaks checking only under debugger or at any time. You can also use additional memory debugging without activating leaks control.
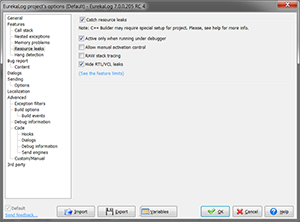
There you can customize resource leaks options. Resource leaks are leak of resources other than memory (GDI, handles, etc.).
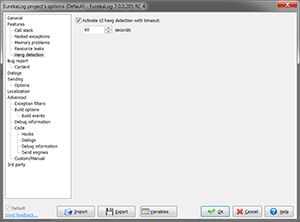
For GUI application you can activate probing main thread for responsivness.
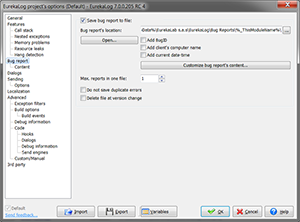
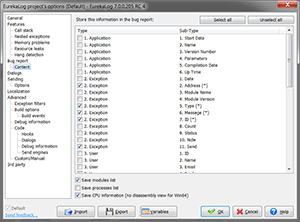
EurekaLog can save error reports into file on disk. You can specify options for this behaviour here. One file can contain multiply reports.
There you can specify what you want to include into report files.
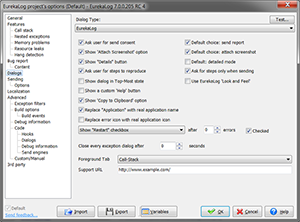
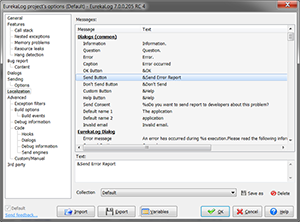
Use the following options to customize the exception dialog style and content. You can choose the dialog type to display. You can customize the HTML code used to display the HTML error page and other options.
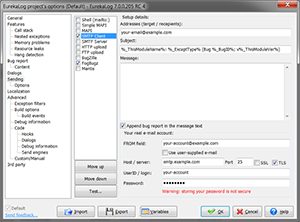
Use the following options to customize the log sending (via e-mail or web). You can choose to send the log via e-mail (4 different methods available), via HTTP or FTP upload, or you can choose to send it to bug tracker. EurekaLog also support SSL or TLS for each method.
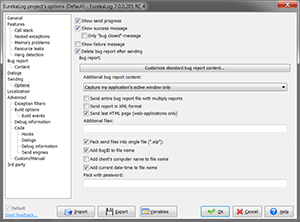
You can customize behavior for sending, including visual feedback, screenshots, ZIP-ing, password-protection, additional files, and other options.
EurekaLog fully supports localization software. You can use ITE, TsiLang, dxGetText or any other localization software. If you don't use localization solution - then you can alter any text message on this options tab.
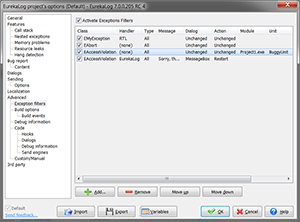
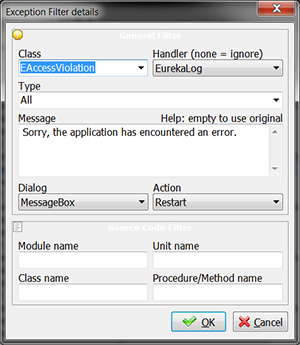
Using exception filters is a easy way to alter EurekaLog's behaviour for different types of exceptions without writing a single line of code.
You can identify exception by class name or source code. For any exception you can alter handler, dialog, message and action.
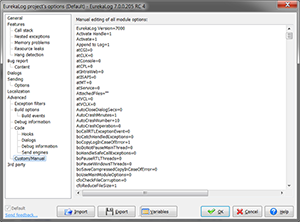
You can manually edit any option or add your own options.
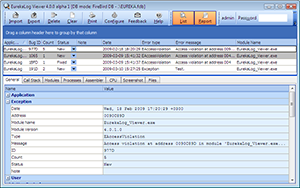
Error report files are usual text files. You can open and view them in any text editor - like Notepad. But you also can use Viewer tool to view error report files. Viewer allows you to filter, group, and sort data. Viewer can be used as pure viewer application or like error database aggregation software (bug tracker).
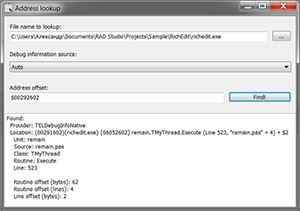
Address lookup tool is auxilary support tool which can be used to convert RAW address into human-readable description.
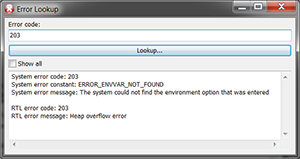
Error lookup tool is auxilary support tool which provide you information about possible meanings of any error code.
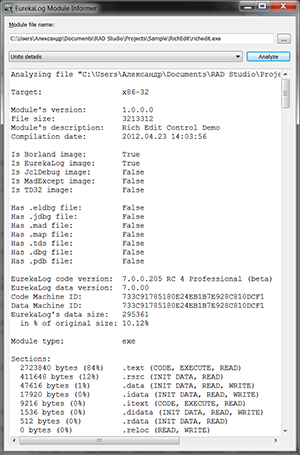
Analyzer tool is auxilary support tool which can be used to inspect compiled executables.
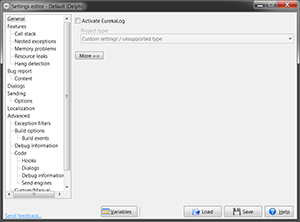
Standalone settings editor tool allows you to edit EurekaLog's project settings outside of the IDE.
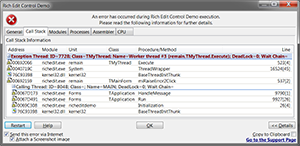
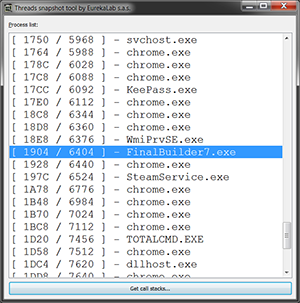
Threads snapshot tool can capture call stack and wait chains of each thread in running application. It's very useful to resolve hangs and deadlocks.