Using EurekaLog with non-Embarcadero DLLs |
  
|
Using EurekaLog with non-Embarcadero DLLs |
|
|
EurekaLog can be used with DLLs compiled by non-Embarcadero compilers - such as Microsoft Visual Studio, etc. 3rd party compiler must generate debug information in some of supported by EurekaLog formats (see list). Your application should use the single exception tracer scheme.
Note: PDB format is a modern debug information format for Microsoft Visual Studio tool chain. It can contain much more information than older DBG debug information format. DBG format support is limited in many tools. For example. It is recommended to use PDB format when possible.
You can mix EurekaLog-enabled DLLs and 3rd party compilers DLLs in the same application. In other words, EurekaLog-enabled DLLs with "Lightweight DLL" profile (i.e. without exception tracer in DLL) are interchangeable with DLLs compiled by 3rd party compiler for all of the 3 cases above (i.e. converting debug information to EurekaLog format, enabling support for additional formats, or using plain DLL exports information). "Standalone DLL" profile is not compatible with 3rd party exception tracers.
For the purposes of this article we will use the following sample code:
MSSample.cpp file:
#include "stdafx.h"#include "MSSample.h"void InternalTest(void){int * P;P = NULL;*P = 0;}void Test(void){InternalTest();}MSSAMPLE_API int fnMSSample(void){Test();return 42;}
MSSample.h file:
#ifdef MSSAMPLE_EXPORTS#define MSSAMPLE_API __declspec(dllexport)#else#define MSSAMPLE_API __declspec(dllimport)#endifMSSAMPLE_API int fnMSSample(void);
Unit1.pas file:
procedure TForm1.Button1Click(Sender: TObject);
This sample DLL is compiled by Microsoft Visual Studio. It contains one exported function (fnMSSample) which calls some internal functions (Test and InternalTest) and raises access violation exception. It is loaded and called by the Delphi project (.exe host).
You should enable EurekaLog for host application. You should do this in the same way as you do it for typical application without any DLLs. For example, if you have VCL Forms application as the host - then you need to enable EurekaLog for host application and set project type to "VCL Forms Application". This will add EurekaLog code and data into final .exe file. It would also set hook for Forms.TApplication.HandleException method, which will allow to automatically handle exceptions without writing any code.
Important note: Please note that above example is not recommended to use in real projects. The example above is created to illustrate differences in debug information for DLLs. It is not intended to illustrate DLL design principles. The problem with example design is as following: the sample DLL does not contain any try/catch handlers, and it lets exceptions escape DLL to the caller. This is usually a bad practice - because the caller may not know how to work with exceptions coming from other programming language. The above example uses hardware exception for illustration. Real-life application will probably raise software exceptions - which are specific to programming language. Thus, a better idea is to wrap fnMSSample function into try/catch block and convert exception into safe error code (a simple flag, integer code, HRESULT, etc.) - as explained in this article.
Since we're going to pass exceptions from DLL to .exe (a not recommended way, but sufficient for our example) - you have to do the following:
You don't need to perform these changes if you're using the recommended approach of not letting exceptions escape DLL. See example here.
Note: notice that event handler for Button1 in the above example calls exception handler (Application.HandleException) explicitly. This is a required action for such code. That is because exceptions from DLL will be handled in default application handler without such explicit call - which happens after DLL will be unloaded. Therefore, an execution will go such way without explicit try/except block:
The last step will fail because DLL was already unloaded. This is the reason behind explicit call to Application.HandleException. Please note that you don't need such call if you use different buttons to load DLL/call function/unload DLL - that is because default exception handler will guard each call of event handler.
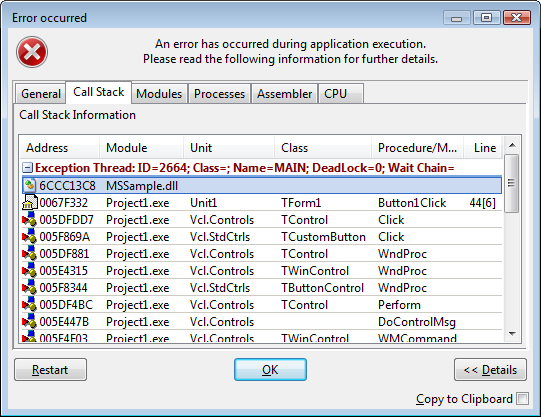
This sample will generate the following error dialog without any additional actions:
Exception dialog for DLL without any debug information support
As you can see: the call stack lists every function within host .exe file - because host .exe has EurekaLog debug information. DLL have no debug information. Therefore, EurekaLog is unable to show call stack for DLL. Empty first line is exact exception address. It is shown always - regardless of debug information available.
Of course, this is not a very useful bug report for DLL. You want to see some functions from that DLL.
There are three possible usage cases for non-Embarcadero DLLs:
Use DLL exports provider (no debug information is available or debug information format is not supported)This approach is not recommended - because there will be inaccurate information in call stacks without debug information. This case should be used only if compiler is not able to produce debug information or debug information format is unknown to EurekaLog. Use this approach as "last resort" measure: to show at least something for DLLs without debug information.
Note: this case is a default configuration for EurekaLog.
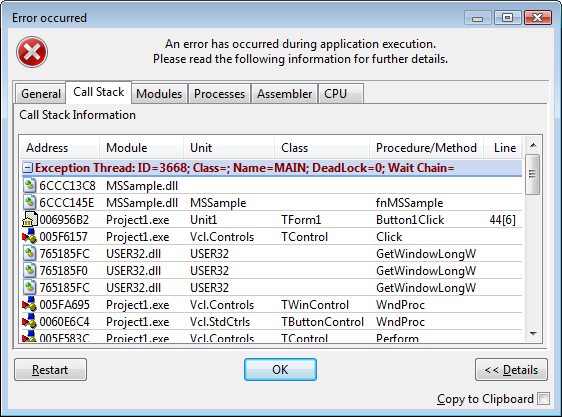
The result error message will look like this:
Exception dialog for DLL without debug information but with DLL Export provider
This example is able to discover name of exported function ('fnMSSample') - thanks to DLL Export provider. However, this example is not able to identify internal functions in DLL - because internal functions are not exported. Therefore, internal functions are not listed at all. And (as always) exact exception location is added to the top of the call stack.
Please note that this example also adds entries for USER32.dll and KERNEL32.dll in the call stack.
Note: DLL Exports provider may show entries like "(possible fnMSSample+132)". Such text means that there are some JMP or RET instructions between start of the function and actual address in a call stack. This means:
Number after "+" sign indicate byte offset between function's start and call stack address. Greater offsets usually indicate greater chance for false-positive entries.
Use 3rd party debug information without converting to EurekaLog debug informationThis approach can be used if you want to use other tools for your executable (for example: Process Explorer, WinDBG, external debugger, etc.). Other tools are not able to recognize and read EurekaLog debug information. Thus, you need to supply and keep debug information in a known format - such as PDB/DBG, TD32, etc. Both EurekaLog and other tools will be able to use this debug information.
For example, we use Microsoft Visual Studio in the above example. You can go to "Project" / "Properties" IDE menu item to open options for your C++ DLL project. Go to "Configuration Properties" / "Linker" / "Debugging" and enable "Generate debug info" option. Go to Go to "Configuration Properties" / "C/C++" / "General" and set "Debug Information Format" option option to "Program Database" (/Zi option for ompiler) or "Program Database for Edit And Continue" (/ZI option for compiler). Build your project. There should be .pdb file available in the same folder as .dll file for your project.
You should deploy this .pdb file with your .dll file.
Enable support for PDB debug information format by enabling "Microsoft Dbg/PDB" option.
Note: you can enable generation of .map files in your Visual Studio projects. However, such files can not be used by EurekaLog. .map files do not have a strict format. .map files are defined as "human-readable plain text files in free form that indicate the relative offsets of functions for a given version of a compiled binary". EurekaLog is able to parse .map files produced by Delphi and C++ Builder linkers. EurekaLog is not able to parse .map files produced by other compilers/linkers/tools.
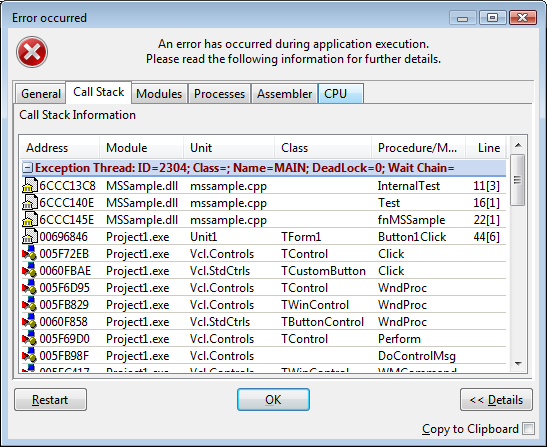
Exception dialog for DLL with .pdb file and enabled MS Debug Info provider
Since DLL now have full debug information available in .pdb file, and EurekaLog has enabled support for reading .pdb files - there will be full information for your DLL in the call stack. All exported and internal functions will be properly identified. All functions will have line numbers information.
Note:
Convert 3rd party debug information format into EurekaLog debug information.pdb files are analog of .tds files (with TD32 debug information): these files are extremely large (debug information file could be more than 10x times larger than executable module itself), binary, uncompressed, unencrypted, store huge amount information about executable (functions, arguments, types, classes, scopes, line numbers, etc. - in other words, all information that may be needed for the debugger). Since exception tracer does not need all this information (units/routine names and line numbers are enough) - obviously, deploying such files along with your DLLs is not a best solution. Surely, you have to use .pdb files if you need to load your DLL into other tools (such as Process Explorer or WinDBG), but if you just want to use exception tracer tool with your DLL - there must be a better way.
A better way is to convert 3rd party debug information into EurekaLog debug information. EurekaLog debug information is compact, compressed, encrypted and stores only minimum amount of information necessary to build call stack. All other extra information is not stored. And you won't need any external helper DLLs - like DbgHelp.dll.
This is recommended approach. You can convert some supported debug information formats into EurekaLog debug information format. You can do this without DLL recompilation.
Ecc32/emake tools can use --el_alter_exe command line switch to specify target .dll file for post-processing (you should use NUL as project file name for --el_alter_exe switch - since your DLL is not a Delphi / C++ Builder project), --el_config switch to specify EurekaLog configuration (you have to use external .eof file since there is no Delphi / C++ Builder project to read configuration from), --el_source to specify debug information source (default source is Delphi / C++ Builder .map files; you have to specify where ecc32/emake should look for debug information).
Notes:
For example, we have Microsoft Visual Studio DLL project as described above. Project have some internal function and exports one function (fnMSSample). You can go to "Project" / "Properties" IDE menu item to open options for your C++ DLL project. Go to "Configuration Properties" / "Linker" / "Debugging" and enable "Generate debug info" option. Go to Go to "Configuration Properties" / "C/C++" / "General" and set "Debug Information Format" option option to "Program Database" (/Zi option for ompiler) or "Program Database for Edit And Continue" (/ZI option for compiler). Build your project. There should be .pdb file available in the same folder as .dll file for your project.
Now, run ecc32.exe or emake.exe with the following command-line:
"ecc32.exe" "--el_alter_exe=NUL;MSSample.dll" "--el_config=MSSample.eof" --el_source=PDB
(you may need to specify full or relative file paths for your files; do not forget to enclose file paths with spaces in double quotes)
This command line will convert MSSample.pdb file into EurekaLog format and inject this information into MSSample.dll file. Options for this operation are specified in MSSample.eof file.
Resulting DLL will have injected EurekaLog debug information - which could be verified by using PE Analyzer (Module Informer) tool. No additional debug information providers should be enabled. The exception dialog will look like this (the same as in the previous approach):
Exception dialog for DLL with injected EurekaLog debug information
This call stack will be the same as in the previous approach: DLL now have full debug information which is injected into DLL file - there will be full information for your DLL in the call stack. All exported and internal functions will be properly identified. All functions will have line numbers information.
The difference from the previous approach is that you don't need to deploy any additional files along with your DLL. All necessary debug information is stored inside DLL file itself.
See also:
| ||||||||||||||||||||||||||||||||||||||||||||||||||||||||||